1. Resumen ejecutivo e introducción
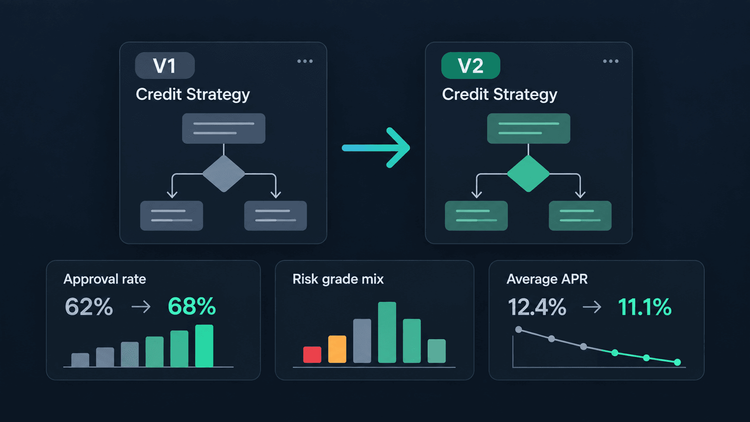
Ejecutar dos versiones de una estrategia crediticia sobre el mismo conjunto de solicitudes muestra how the change moves approval rates, risk grade distribution and the parameters of the loans you offer, before a single live applicant is affected. It catches the effects you did not intend: a new policy rule that blocks more volume than expected, or a scoring change that quietly shifts approvals into lower priced tiers. What it cannot tell you is how the newly approved loans will behave once they sit in the portfolio, which is why the three methods described below serve different purposes. Where DecisionRules runs the credit decisioning, this comparison happens in the Decision Intelligence cockpit inside the application
2. Inteligencia de decisiones crediticias en la práctica
Veamos un neobanco típico que utiliza DecisionRules para definir sus estrategias crediticias y ejecutar sus decisiones de scoring.
Proceso de scoring crediticio
The complex credit scoring rule (created using a Decision Flow rule type) covers eligibility criteria, calculation of score, evaluation of affordability, assignment of final credit limit, and policy rules routing the application to either approval, decline, manual approval or alternative limit assignment.
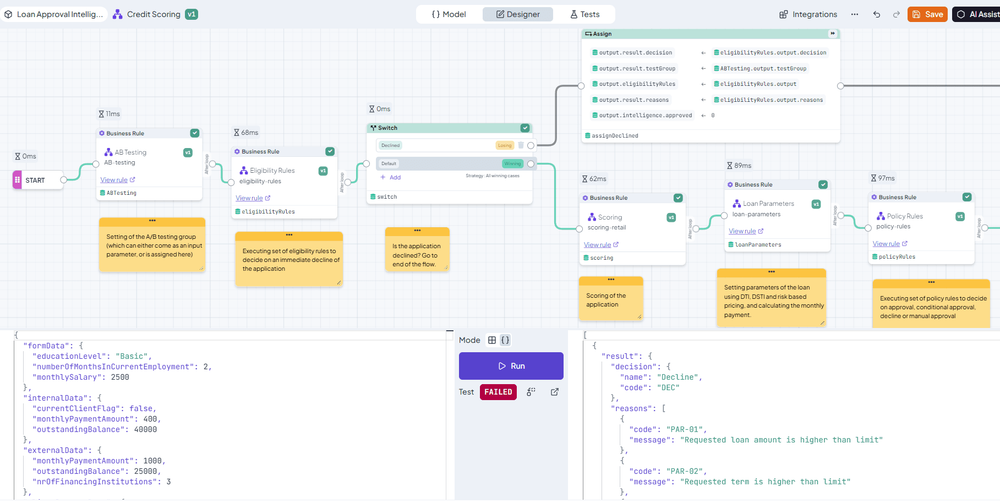
Neobank’s Credit Scoring rule producing decision on loan application
This rule is executed in DecisionRules as part of the loan application process. When doing a strategy change, a new version of the rule is prepared and its impact on the decisions can be verified prior to launch to production - inside DecisionRules using its Decision Intelligence feature.
Panel de Decision Intelligence
The Decision Intelligence cockpit in DecisionRules (Decision Intelligence -> Statistics) enables users not only the real-time rule monitoring, but also to compare rules together, typically 2 versions of the same rules that run either in parallel (in some A/B testing regime) or in different time periods.
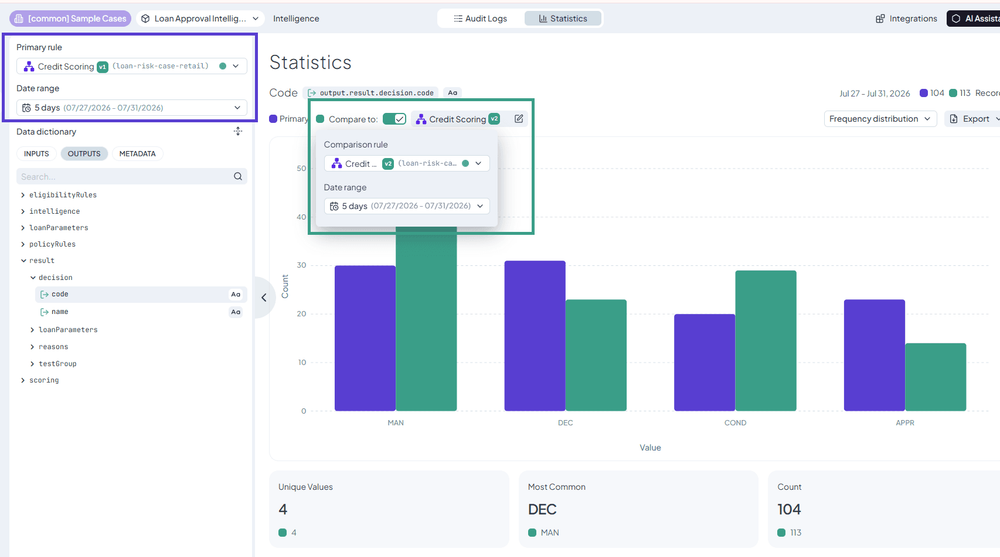
Comparison of results of 2 versions of scoring process over the same or different time range - choose primary rule and time range, click on Compare to and choose secondary rule and time range.
Veamos cómo un prestamista puede utilizar esta función en la práctica.
3. Cambios bajo control: análisis de impacto con Decision Intelligence
Realizar cambios frecuentes en las estrategias crediticias es una parte inevitable de una gestión de riesgos adecuada. Poder evaluar su impacto, especialmente antes del lanzamiento, es fundamental para mantener los riesgos bajo control.
Variantes del análisis de impacto
Análisis ex post
Ex post impact analysis is the most intuitive part of any change management. You deployed a new version of the process, and you want to make sure it behaves as expected, so you must take the results of the new version and compare it with some relevant outputs of the previous version.
Needless to say, the two samples are never the same, and before you realize that something does not play well, you can lose a significant amount of money through future losses or income, or, even worse, lose reputation or breach regulatory requirements.
Simulación
A much safer way of analyzing change impact is simulation. Run the two versions of credit strategies over exactly the same sample of applications and analyse the change in decision outputs on approval rates and provided product parameters.
Yet simulated impact analysis gives you answers about the impact of the change on these immediate characteristics, it does not give you an answer regarding the behavior of the loans newly entering the portfolio.
Pruebas A/B
Only A/B testing can answer this question, by testing the new strategy in a controlled manner on a subset of applications, and observing how they behave. The risk you are exposed to is controlled and documented, and you can study the behavior of newly approved applications without significantly impacting your portfolio.
Comparar estrategias en DecisionRules Decision Intelligence
Regardless of which type of impact analysis you want to run, you can utilize Decision Intelligence:
- for ex-post impact analysis by comparing the loan approval process production data over two time ranges (first before the change and second after the change)
- for simulated impact analysis by running two versions of the loan approval process on a sample data in non-production environment
- for A/B testing by comparing the Champion and Challenger processes data on production environment
The tool gives you the possibility to compare distribution of the values, averages and counts, as shown in a few examples below.
Escenario 1: mejorar el modelo de scorecard
Imagine you changed a scorecard used in the process for a new model that better differentiates good and bad clients and enables a higher approval rate. You created version 2 of scoring rules and want to compare both, to see whether change of the model results in higher approval rate and which impact it has on parameters of provided loans, in this case mainly APR, as you use risk based pricing.
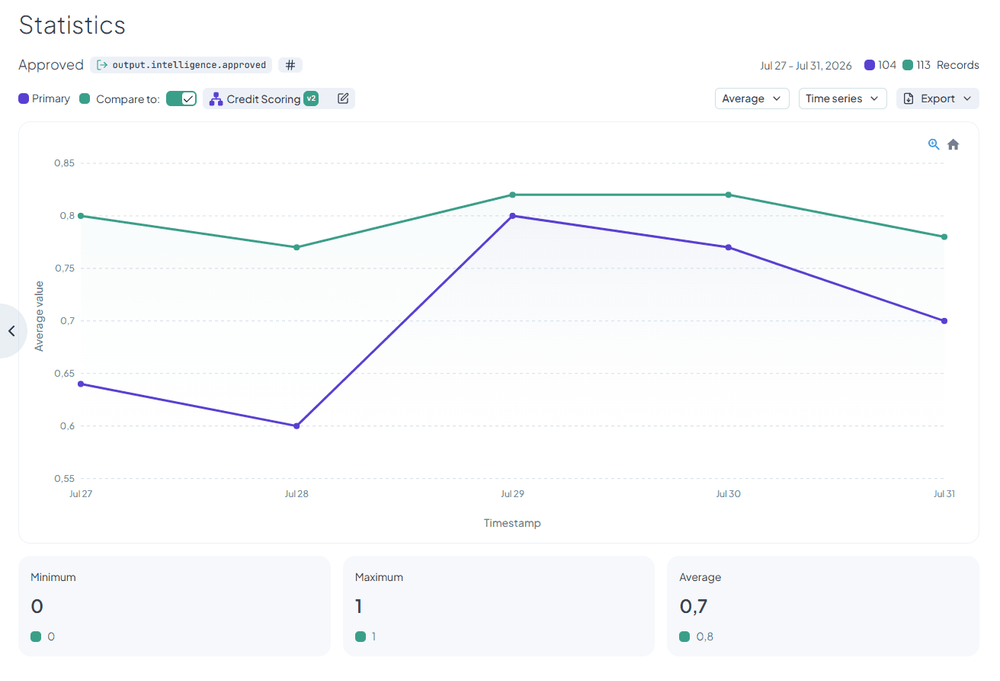
Comparing approval rate of two versions of the scoring process over the same time range shows that the impact is in the expected direction, as the approval rate of the new version of the process (green) is above the original (blue). The difference between them is changing day-to-day because of the mix of applications (depending on what percentage of applications is affected by the change).
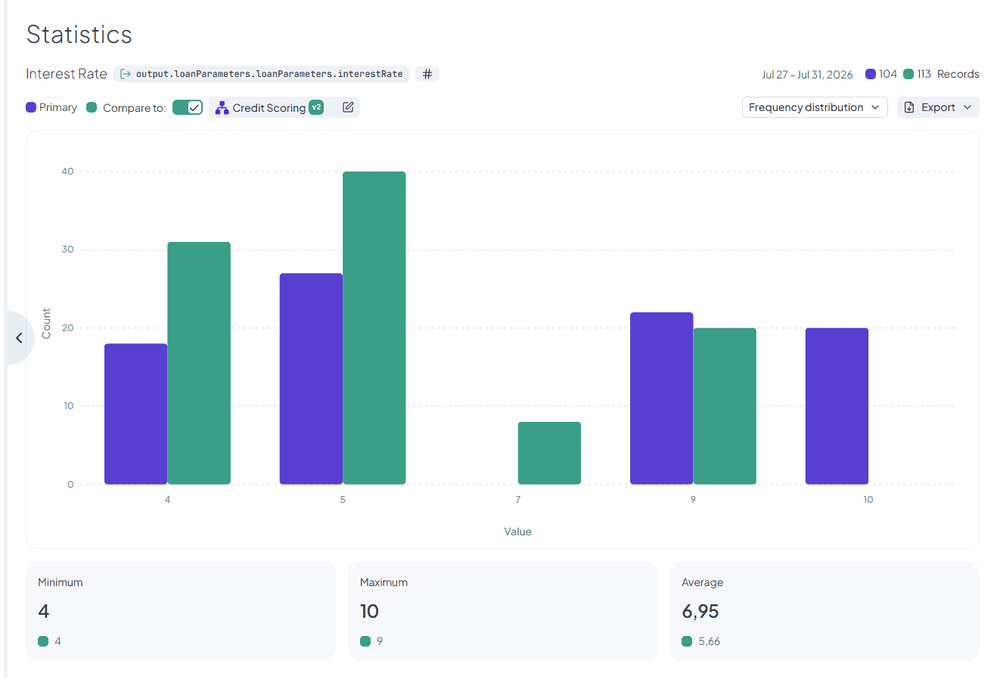
Comparing distribution of APR and the averages for two versions of the scoring process shows you the impact on the provided loan - shift towards lower interest rates is clearly visible here.
However, you also need to verify indicators which are closer to the executed change, to see that the effect was really caused by change in score - here, risk grade distribution is what you want to see.
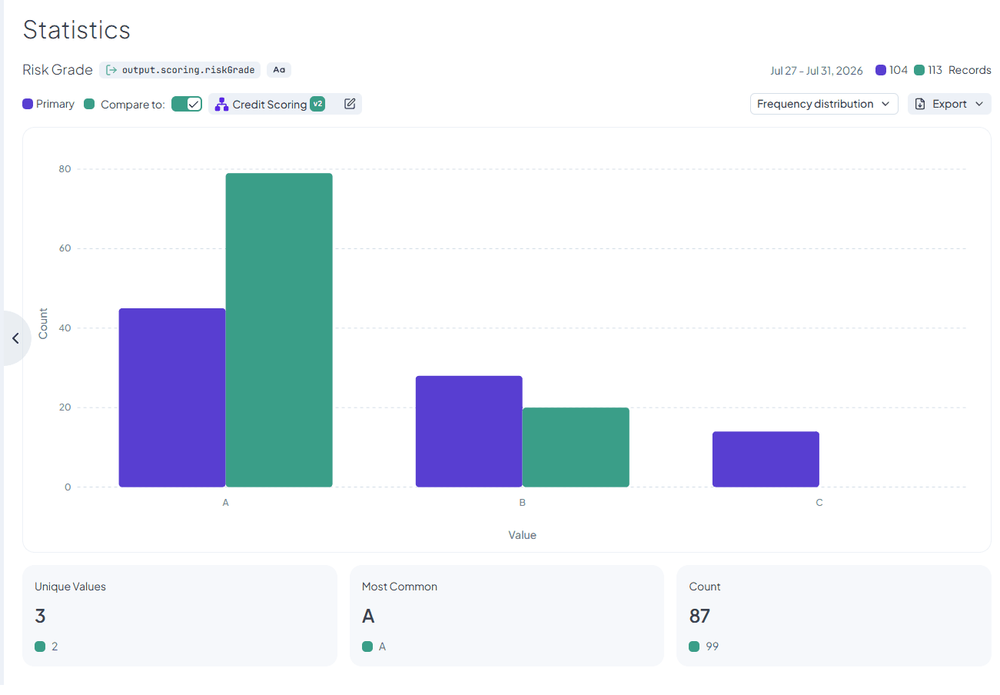
Comparing grade distribution over two versions of the scoring process - you can see that the new process brought a shift towards grade A, thus increasing the average score and placing a baseline for decrease of interest rate when risk-based-pricing is utilized - this should lead to higher conversion rates.
Escenario 2: flexibilizar las reglas de política
Imagine you deactivated an eligibility rule for the minimal income to let more clients go through the process and let the decision be only based on the affordability calculations. You created version 3 of scoring rules and want to compare both, in this case mainly to track closely how these new low-income clients will be treated by the system, expecting the final impact to be seen in approval rate, loan amount, term and APR distribution.
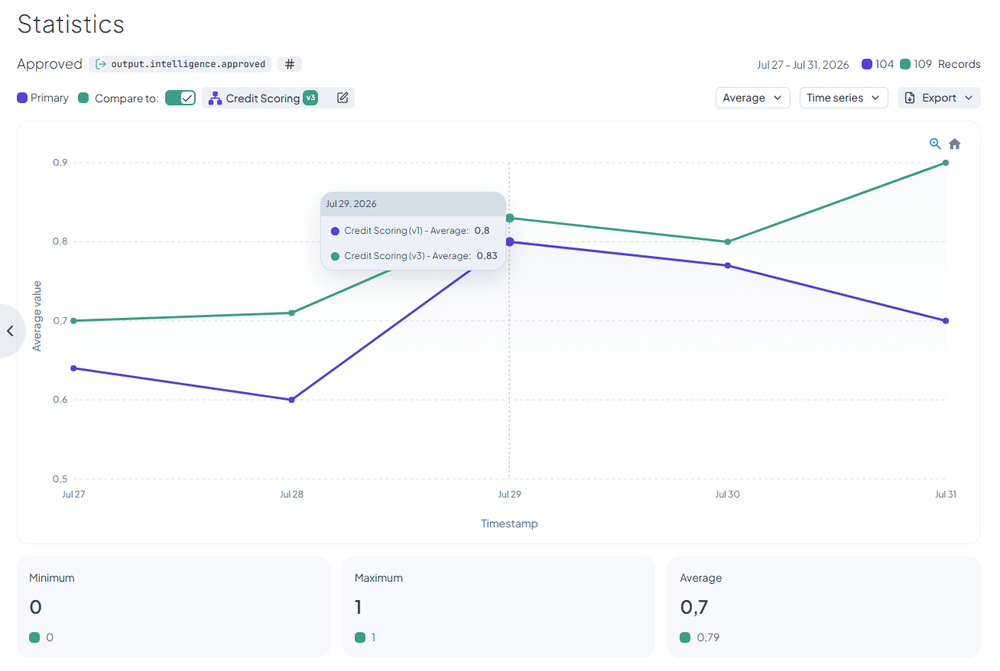
Comparing approval rate of two versions of the scoring process over the same time range shows that the impact is in the expected direction, as the approval rate of the new version of the process is above the original. Again, the difference between them is changing day-to-day because of the mix of applications
And again here, you also need to verify indicators which are closer to the executed change - verify, whether your low income policy has really been deactivated, and which impact in had in other eligibility rules frequencies.
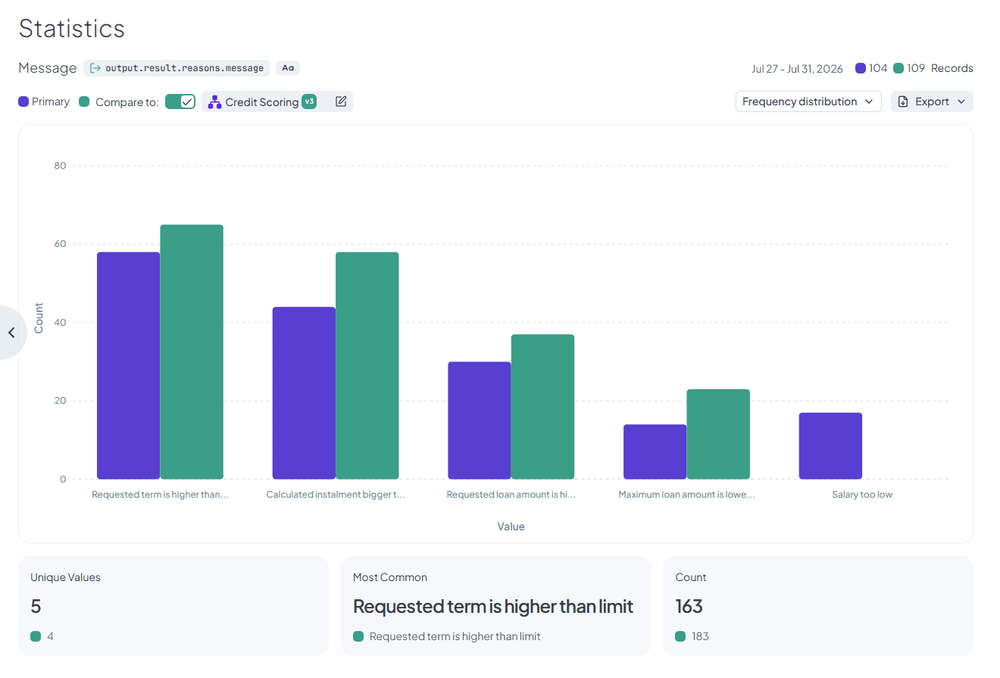
Comparing decision reasons over two versions of the scoring process is the closest insight into whether what you did really worked - here you can see the deactivation of the rule “Salary too low”. If the other reasons stayed the same, this would actually indicate that something is wrong, as you cannot expect all low-income clients to go through the process, getting the loan they required - here you can see an increase of the other reasons, mainly those related to required vs. maximum loan amount and instalment which, in our case, lead to manual underwriting.
4. Conclusión
The Compare feature in Decision Intelligence lets a risk analyst answer the question that decides whether a strategy change gets approved: what exactly will this do to our approval rate, our grade mix and our pricing. The answer comes from the same tool the rules live in, without exporting logs or building a separate reporting layer first.
That changes when the question gets asked. Instead of waiting for the first cohort to mature and explaining the numbers afterwards, the risk team brings them to the decision.